Moving to MY Happy Trading

HappyTradingBlog has moved to My Happy Trading.com. Please come by to say "hi" by clicking here!

Wang's Happy Trading Daily Posts

Showing posts with label SP 500. Show all posts

Tuesday, April 17, 2007

4/17/07 Review: Nasdaq, NYX, SP 500, DOW, INTC, IBM

Wow, that was another "exciting" day, huh?! Ok, it's healthy to rest a bit after days of continuous excitement. The markets were pretty much flat today. A little consolidation was perhaps what the markets needed to continue this rally. SP 500 stayed above its Feb. high. The DOW made a small gain of 52.58, while Nasdaq gave up just 1.38.

Nasdaq daily chart:
Nasdaq closed right above its daily upper BB. MAs are still going up nicely, and so is the MACD.

Nasdaq intraday chart:
Perhaps the intraday chart shows a more meaningful picture. The "little rest" today allowed Nasdaq to let off some steam in the MFI, while not losing any altitude. Now, it has more room to continue to up-trend. Perhaps we'll see it continue to climb its upper BB!

One interesting stock today was NYX. It gained 2.95 to close at 96.15, above the range that it had been trapped in for a week. It had a nice buying volume and looks like it might try testing 100, again, soon!

Both INTC and IBM reported solid earnings AH. So, let's see if the markets will continue to push upwards.

Monday, April 16, 2007

4/16/07 Review: Nasdaq, SP 500, SOX, Biotechs, OIH, GLD

The markets had some great performances today. As mentioned earlier, the SP 500 index, SPX, has already surpassed its Feb. high, while the Nasdaq and the DOW are in position to challenge theirs. SOX managed to eke out a gain. The biotechs are still hot! Both OIH and GLD made good advances. And, there are lots of mergers and acquisitions going on! It's an exciting time to be in the markets!

Nasdaq Nasdaq caught up with its daily upper BB today and it is within range to overtake its Feb. high! The daily MAs are curving up even more, gaining momentum!

SOX SOX managed to eke out a gain, but, need some big moves to catch up with other sectors. The good thing is that the daily MAs seem to start to curve up again! It needs good earnings news from some of the big industry names, such as INTC and TXN! If these big semiconductor stocks start to run, it should provide SOX with some needed momentum.

OIH Another nice advance for OIH. It's riding the upper BB up nicely. Buying volume increased again. Although the daily techinical indicators may be toppy, the month chart still shows room for more upwards action!

GLD GLD had a little breakout today. Closing above its 6-month high of 68 on high volume!

Markets are hot!! Let's hope that SOX, the semiconductors, will start catching up with the other sectors this week! Happy trading!

Saturday, April 14, 2007

4/13/07 Weekend Review: Nasdaq, SP 500, OIH, GLD, biotechs, SOX

That was a fun week! The major indices are pretty much back to the levels before the February sell-off, with SP 500 closing just above its respective level. Biotechs are the darlings of the markets right now; they are hot!! SOX, the semiconductors, is still trying to sort out a direction. The oils and metals continue to charge upwards. Since it's the end of a week, we'll be looking at some weekly charts:

Nasdaq gave us another good day on Friday!
It is less than 9 points away from 2500, the level before the sell-off. The daily MAs are moving up nicely, and both the MACD and the RSI are going strong!

The week was a great week for Nasdaq! We can see higher highs and higher lows on Nasdaq's weekly chart, and the SAR has just turned up. Weekly MACD and RSI continue to rise!

SPX, SP 500, is still strong! It's weekly chart shows that it closed "above" the level before the sell-off (1450), and it's ready to test the February high at around 1461, less than 9 points away!

The oil service companies, represented by OIH, have gone higher, also! Its weekly chart shows a very bullish picture: has caught up with the weekly upper BB; MAs lined up with 10- above 20- above the 30-week MA; its MACD, MFI, RSI, and volume are all rising strongly!

GLD, or gold, is not doing bad either: GLD is almost touching the weekly upper BB; its SAR has turned up; MACD, MFI, and RSI are rising, also!

So, the markets seem to be ready to test the Feb. highs! Nasdaq is getting stronger with lots of help from the biotechs. We still need to see the semiconductors join the rally and break above its multi-year range. The oils and metals are still strong!

Wednesday, April 11, 2007

4/11/07 Review: Nasdaq, SP 500, DOW

So, once again, the Feds spooked investors! =) The timing was about right, though. It's about time the markets take a little rest. Let's take a look to see where we are at:

The Nasdaq closed above support (2456.5) at 2459.31.
What's positive for today was that the 30-day MA finally turned up! We'll have to see now if the 10-day MA can act as a support, while the intraday charts work off some steam!

Nasdaq intraday: On the intraday chart, we can see that Nasdaq really hit the tops of this near-term cycle at the end of last week. It was able to sustain the levels as things started to cool off earlier this week; probably people wanted to wait and see what comes out of the Fed's minutes.

The DOW faired a little less well.
It closed below the support around 12500, but, it did bounce off of the 10-day MA. The SP 500 shows similar charts to Nasdaq.

Now, the test is to see how fast can the bulls regroup, whether the 10-day MA will be strong enough as a support, and, if it is, whether the indices can continue the uptrend to re-test the Feb highs.

Tuesday, April 10, 2007

4/10/07 Review: Nasdaq, SP 500, SOX, GLD, OIH, AA

Markets had a good day today with the major indices all closed in the green. Even SOX, the semiconductors, had a good day!

Nasdaq, up 8.43, at 2477.61!
If we look closely, we can see that Nasdaq's 30-day MA is starting to flatten out. A few more consecutive up days should turn it up; but, we'll need to see some strong days, up 20-30 points, to catch up with the upper BB! The MACD and RSI are still rising nicely!

We can see the 30-day MA action more clearly from the SP 500, SPX: See the 30-day MA flattening?! SPX is almost back to the level before the sell-off. Breaking above this level, which is about 1450, should bring a test of the Feb high!

SOX had a strong day! It closed up 3.81, at 476.58. Its MACD just turned positive today. We should see some continued, upwards momentum tomorrow!

GLD, ETF tracking gold, also went up today. Looks like it's starting to move along the upper BB!

OIH, ETF for the oil service industry, made a new 6-months high!
It closed above 150, a psychological barrier, at 152. 52-wk high is at 169.75. It's getting toppy, but, the upwards momentum is still strong, and the monthly chart says there's still room to go!


AA reported earnings above estimates in AH. Let's see if it can help bring some more positive energy to the markets tomorrow. We still need a few more up days to get those 30-day MAs turned!

Saturday, April 7, 2007

4/6/07 Weekend Review: Nasdaq, SP 500, SOX, BTK, CMGI, ICGE, SFE

The 1st week of April turned out to be a great week! The major indices continued to rise and are looking like they might soon re-test the highs set in February. Both biotechs and semiconductors made solid moves up and certainly helped to push the major indices higher.

Let's take a look at the Nasdaq:
Nasdaq had a nice day on Thursday to close out the week (so did SP 500 and the DOW), showing that buyers are still in control. The 20-day MA has crossed above the 30-day MA, but, we still need to see that 30-day MA turn up. The Nasdaq needs to now catch up with the upper BB; this should enable the 30-day MA to turn up!

The semiconductor sector is getting more and more positive attention. The SOX made 3 nice, consequtive, days of advances to close above 475. Now, the MACD is almost positive and the RSI is rising nicely. Notice that the upper BB is not so far away!

The biotechs are picking up a lot of momentum in the past few weeks. Let's take a look at BTK, the AMEX Biotech Index. BTK closed on Thursday above the resistance at 790! It is now in the clear to go even higher. The MACD is also rising nicely and the strength is high, as shown by the RSI. If fact, BTK is very close to re-testing its all-time high set in 2000(see the 10-year chart)!!

Another sector that looks interesting to me is the internet incubators. A lot of people have probably forgotten these since 2001. But, they seem to have recently gotten some renewed buying interests. CMGI, ICGE, and SFE have all made some nice upward movements lately. There's even an interesting article from Forbes about them.

So, the mjoar indices are in striking distance to re-test the February highs; the biotechs have taken off; the semiconductors are starting to move up (and, they need to break out of their multi-year range; see my post on 3/31/07); the commodities are still strong. If we see the buyers continue to push the major indices up and allow them to catch the upper BB, we might have new highs to look forward to in the next couple of weeks!

Wednesday, April 4, 2007

4/4/07 Review: Nasdaq, SP 500, DOW, SOX

The markets enjoyed another nice day today. The major indices pretty much close just above their immediate resistances (the highs made after Bernanke's speech last week). The DOW closed at 12530.05; SP 500 at 1439.37; and, Nasdaq at 2458.69, the strongest percentage-wise. The semiconductor sector also rallied 4.42 points to close at 473.02.

Let's look at some charts:
The daily charts are pretty much the same story, besides that we continued to rise and closed just above the immediate resistances. Nasdaq closed above the 2457 resistance, but, still need to see that 30-day MA turn up! MACD and RSI continue to rise.

The intraday charts, however, are getting maxed out. So, are we breaking out of here to re-test the February highs? Let's take a look at the 15-minute chart: We see that on the 15-minute chart, the MACD is flattening. If we find enough strength tomorrow to make this MACD rise up again, we may find that the buyers are still in control. I think it'll be interesting to see how the Asian markets hold up overnight tonight.

SPX, or the SP 500 index: SPX pretty much shares the same story as Nasdaq, but, a little better. Notice that its 20-day MA (blue line) has just risen above the 30-day MA (black line). Maybe it's something that Nasdaq can look forward to in the next couple of sessions?

How about the semiconductors?
SOX made a nice advance to close above 470! The MACD has curved up and the RSI is rising. Even the 20-day MA turned up too! We need to see it break the resistance at 473.8 and go above 475!

We should be cautious tomorrow, especially because Friday is a holiday; so, tomorrow is the last trading day of the week. In the next couple of trading sessions, we should be able to sort out the near-term direction of the markets. Commodities, however, still seem to be strong.

Tuesday, April 3, 2007

4/3/07 Review: Nasdaq, DOW, SP 500, GOOG, RIMM

It was a very nice day for the markets!! The DOW closed above 12500; Nasdaq closed above 2450; and, SPX, or the SP 500, added more than 13 points! The major indices are ready to break some immediate resistance and perhaps retest the highs reached in February. SOX added more than 3, and, we definitely need to see the semiconductors rally more! SOX needs to break out of the range that it's been stuck in for years, shown in my entry on 3/31/07.

So, let's take a look at some charts and see where we stand: Nasdaq came near the immediate resistance at around 2457. It needs to break that and catch up with the upper BB. The MACD and RSI turned up nicely. We still want to see that 30-day MA turn up!

Let's see what the intraday chart is saying: The intraday indicators show that there is still some more room to go up! Let's see if we have enough momentum to break through that resistance around 2457. (The other major indices show similar near-term patterns.)

GOOG, with an announcement of a satellite TV ad deal with EchoStar, had a great day, which probably helped spark the market rally also!.

GOOG caught the upper BB today and is ready to ride it up! MACD, RSI, MFI all turned up, and the buying volume was high!

RIMM had a similar day as GOOG, and it is reporting on 4/11. RIMM also caught up with its upper BB with technical indicators going up nicely!

So, tomorrow, we'll need to see the major indices break their immediate resistance levels. Then, we can hope to retest the highs set in February!

Monday, April 2, 2007

4/2/07 Review: Nasdaq, SP 500, NIHD, MICC, KYPH

The commodities stayed strong today and the broader markets did close green. The broader markets still seemed a little indecisive, until the EOD (end of the day). So, let's see if we can get some clues as to what's going on.

Nasdaq closed above the 30-day MA.
But, we still need to see that 30-day MA turn up (same story for the SPX, or SP 500). The 20-day MA is now going up nicely (blue line).
The intraday, hourly chart can perhaps provide some missing clues. After we tested the bottom last Thursday, some sorting out and back-and-forth needed to happen. We see that Nasdaq now have gotten above the intraday MAs (similar actions exist for the SPX), we might see some upwards momentum tomorrow.

The telecoms did well today. NIHD was one of the leaders. It made a nice advance above the resistance at 75.3 and had great volume to go with it. The MFI, RSI, MACD are all looking good. Might be in the 80s soon.


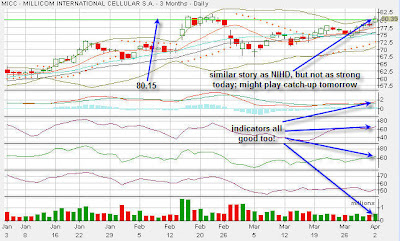
MICC had some similar actions as NIHD, but, not quite as strong. Indicators are all good and the volume went up a bit. 52-wk high is not that far away at 82.04. Catching the upper BB and closing above the resistance (80.15) may allow it to play some catching-up tomorrow and head for a new 52-wk high!


KYPH had a nice day, also! It broke above resistance @ 45.5 with great volume. This thing may be ready for a new 52-wk high also, which is only 48.45.

Saturday, March 24, 2007

3/24/2007 Weekend Review: Nasdaq, SP 500, SOX, GOOG

What a week for the markets!! S&P 500 scores its best week since 2003! Let's take a look:

Nasdaq on Friday was very choppy. The ticker actually showed 4+ points in the green at the close. I even called Fidelity to make sure that was correct because seconds before the close, it was in the red. The Fidelity's representative confirmed that it "seemed" correct. But, an hour, or so, later, "after" the close, Nasdaq showed -2 points. That, was very strange! But, let's not fuss with it and call it a "flat" day.
In any case, Nasdaq did quite well for the week. The 10-day MA is above the 20-day MA, and, the 20-day MA is flattening. We still need to close above 2456. The upper BB is very close now; would like to see it start to curve up, or at least flattening. If Nasdaq catches the upper BB, it can go into breakout mode and push the upper BB wide open.

The S&P 500 shows a similar chart as the Nasdaq, but, the upper BB is much closer. Breaking 1438 would likely allow it to catch the upper BB and run!

The SOX is an essential part of the rally. It has to participate, if not lead. The BBs are narrowing in now and I would very much like to see the 20-day MA turn up. An interesting thing that I noticed is the period between around 10/16-11/10/2006. The situation is almost identical to the one it is in now:
First, it starts with reaching a high, going above the upper BB. Then, it is followed with a sharp downturn. Then, a bounce, but, fails, only to be followed by a sharp rise that creates a W. And, the tailend of the W catches the upper BB with enough momentum to create new highs! Both times, we see the BBs closing in before the tailend of the W makes a powerful jump and taks off! The history is likely to repeat itself. Next Monday and Tuesday will give us good clues.


GOOG finished a nice strong week. It did close between 460-465, which is quite "goog", or good! =) The lower volume on a flat day is a good thing. I would like to see that 20-day MA start to turn up! We'll need a strong day on Monday. Breaking 465, only some 3 points away, would basically allow GOOG to catch the upper BB and run. If that happens, the initial resistance is around 480.

Many analysts are looking for GOOG to go above 550, and perhaps even above 600; and, I "feel" that it will. But, it seems that every time GOOG hits 510, the sellers are there waiting. I think GOOG needs to finally get that split. Psychologically, 300 is a lot easier to handle than 600 for such a big company. April just might bring us the good news and people might already be gearing up for it!

So, the major indices are mostly in similar places:

1) They've all successfully tested the bottom twice.

2) They've all gone above the 10, 20, and 30-day MAs.

3) They all have the upper BB within reach.

If we get some strong follow-through rallies on Monday and Tuesday, we might just have enough momentum to hit new highs!

Thursday, March 22, 2007

3/22/2007 Review: Nasdaq, SP 500, GOOG, RIMM, telecoms, semi-conductors, metals, oils

We did pretty well today. The DOW managed to close green. As I pointed out last night, the intraday charts were toppy, and it did turn out to be a choppy day. Let's see where we are now:

The Nasdaq needs to manage to close above 2455; it would be a bullish note and would set up for the re-test of 2500! I would like to see the 20-day MA (yellow line) to start turning up. Notice the BB are closing in.

Let's take a look at the broader markets, SP 500:

The chart looks similar to that of the Nasdaq, but, the upper BB is much closer. If SPX manages to break 1438, it has a good chance to catch the upper BB and perhaps break out higher!

GOOG did very well today, up 5+ points!

GOOG closed above the 30-day MA today! Go Google!! I think it will test 465 tomorrow. The MACD is going up nicely and the volume is very good. The intraday charts (not shown) are still toppy. If GOOG can mange to close between 460-465, and allow the intraday charts to let off some steam, it would be very good. The upper BB is very close. If GOOG can take a little rest, and break higher next week, it may be able to catch the upper BB and run with it!

I wanted to take a look at RIMM because I think some bullish opportunities are shaping up! RIMM has been caught between 130-137 for a couple of weeks, but, it made some good advances today:

It tested 137 intraday, but, closed below it. The buying volume was nice, and the MACD and MFI are both curving up!
But, the intraday charts are toppy. I think if RIMM holds 135-137 while allowing the intraday charts to take a break, we may see good bullish opportunities next week. If RIMM re-tests 137 and is able to break it with strength, we may see new highs very soon!

So, we are at a place very similar to last night: the intraday charts are still toppy. We certainly need the telecoms and the semi-conductors to participate in the rallies. The metals and the oils, especially the oils, still look strong.

One important note is that, for most of the indices, the BBs are closing in on the daily chart. We may see a couple of more days of consolidation. But, the upper BBs are all pretty close. So, if the markets take a small rest and rally again, they may just catch the upper BBs and break higher!